We have all heard the statistics; about 70% of your customers are abandoning your shopping cart without actually making a purchase. To put that in perspective, out of every 10 people who reach your checkout page, only 3 make a purchase. The remaining 7? Poof! They’re gone!
This is a fact and not industry specific. Shopping cart abandonment rates have been consistent across all eCommerce industries for the last 5 years. Business Insider reports that approximately $4 trillion worth of products will be abandoned in online shopping carts this year. And 63% of that is actually recoverable!
But what can we do about it? The holidays are coming here, we’ve got products to stock, orders to fulfill, and emails to send. Who has the time to spend countless hours wading through analytics to discover our shopping cart abandonment problem?
To simplify things for you, we’ve created a simple 5 step process to track your cart abandonment. You can implement this in 5 minutes and start collecting data about what’s causing customers to abandon your cart. Then, when you’ve identified the issue, you can A/B test a few changes to find the best solution.
Why Customers Abandon Carts
Before we try to fix the problem, we first need to understand the reasons behind cart abandonment. Statista conducted a survey of online shoppers to figure out what made them drop out of the checkout.
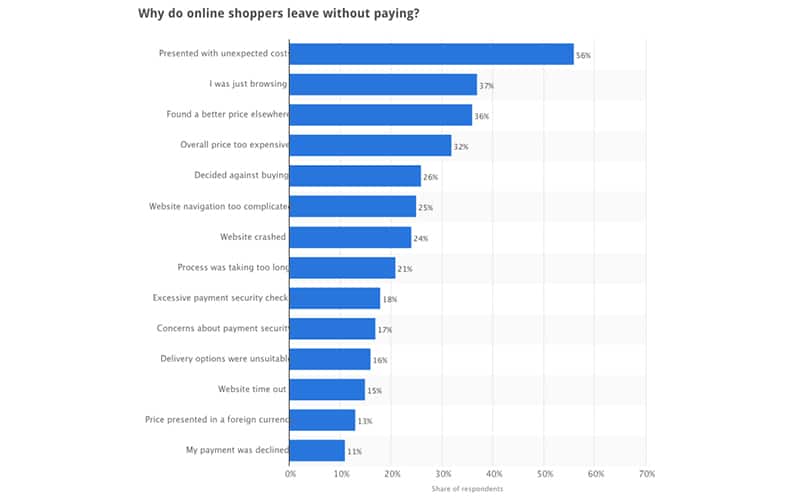
It’s likely that customers are abandoning your cart for one or a combination of the above reasons. There could also be other reasons specific to your store.
Instead of guessing at what the reason could be, let’s pinpoint the issue with Google Analytics. By tracking your checkout funnel, we can find out at what stage your shoppers are abandoning you and see if it corresponds with one of the above reasons.
After you identify the issue, you can test a bunch of solutions and create the conversion machine your eCommerce store is supposed to be.
Set Up A Funnel In Google Analytics
To start with, let’s calculate your current cart abandonment rate. If you haven’t set up your analytics already you can calculate it manually. You might want to sit down for this!
Use the formula:
Cart Abandonment Rate =
1 – (number of orders placed/number of shopping carts created)
But you work hard enough already, so let Google Analytics do the grunt work for you. You’ll need to integrate your eCommerce store with Google Analytics first. It doesn’t take too long, and we’ve created a document that shows you how to do it.
Tracking Cart Abandonment in Google Analytics used to take some manual work but now Google Analytics does this automatically.
If you set up enhanced eCommerce Tracking to start tracking your Cart Abandonment all you need to do is navigate to:
Conversions -> Shopping Behavior
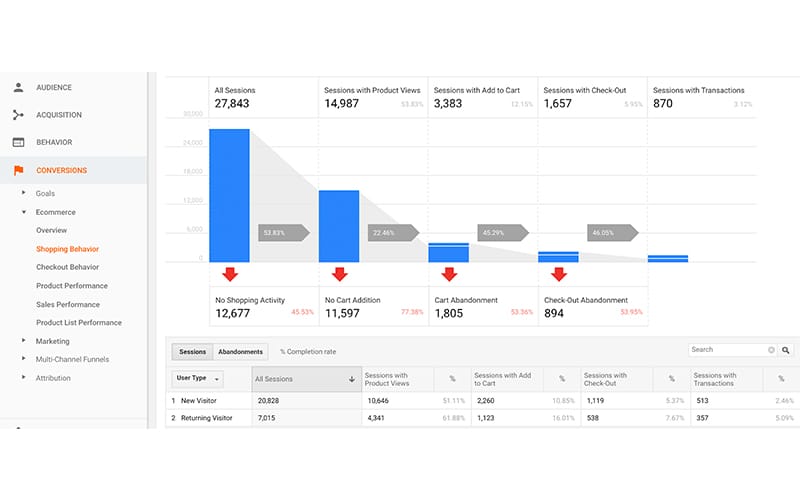
This rad new report is super powerful and you can even create custom segments to retarget to.
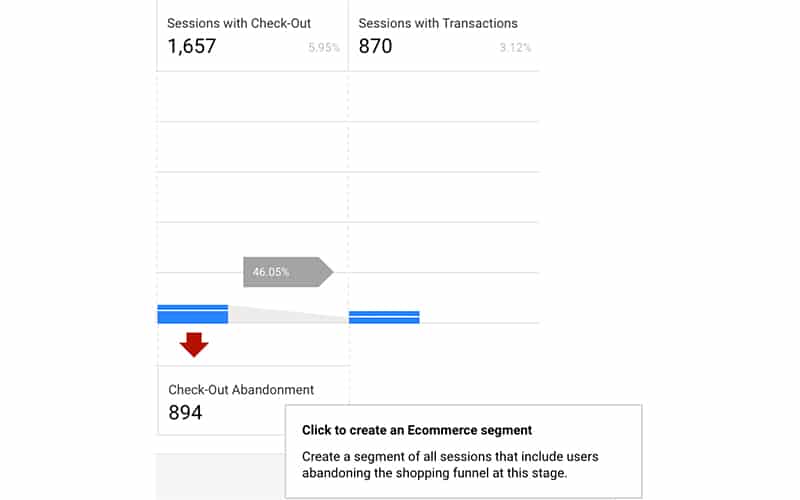
Each one of these segments can be marketed to differently. For example, if someone doesn’t view a product you can send them ads showing them what life would be like with your product.
For those who abandoned the process at checkout you can test out a winback campaign with different offers.
Test giving $5.00 or 10% OFF as an incentive for them to complete their checkout now.
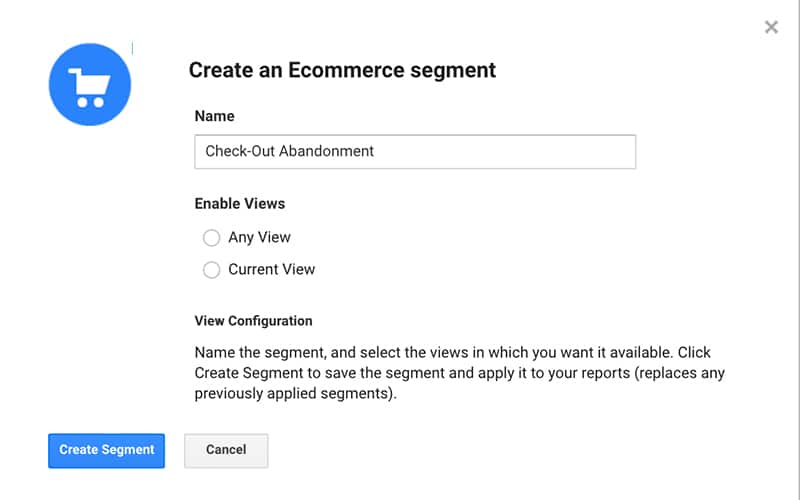
Though this is tracking automatically in Google Analytics you can track shopping cart abandonment the old school way.
Step 1: Create a Goal
From your Google Analytics Admin panel, head to the Goals section under the third column ‘View’. Be sure to select the right account and property. If you have multiple accounts or properties, you can identify the right for your store with the unique Google Analytics tracking code.
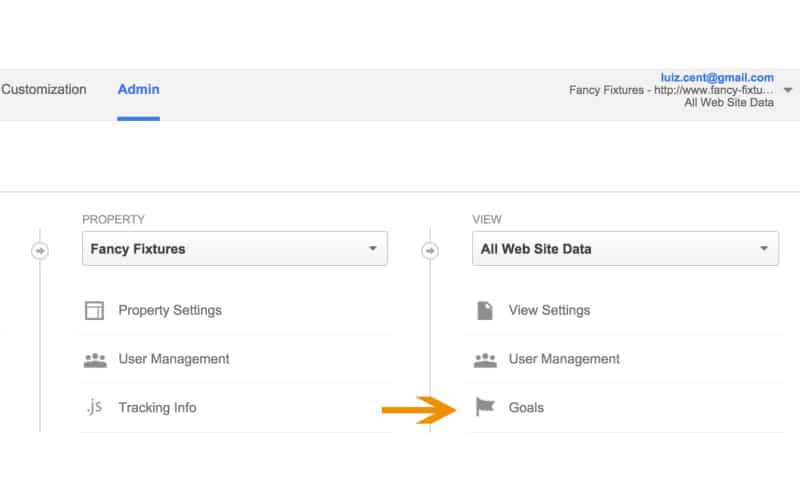
On clicking through, you’ll be taken to the ‘Goal’ page where you can create a new goal.
Step 2: Goal Setup
Click the red ‘Create Goal’ button to create a new one. To start with, you need to select a template that defines what kind of goal you want to track. For cart abandonment, you want to select the ‘Checkout complete’ under the ‘Revenue’ section.
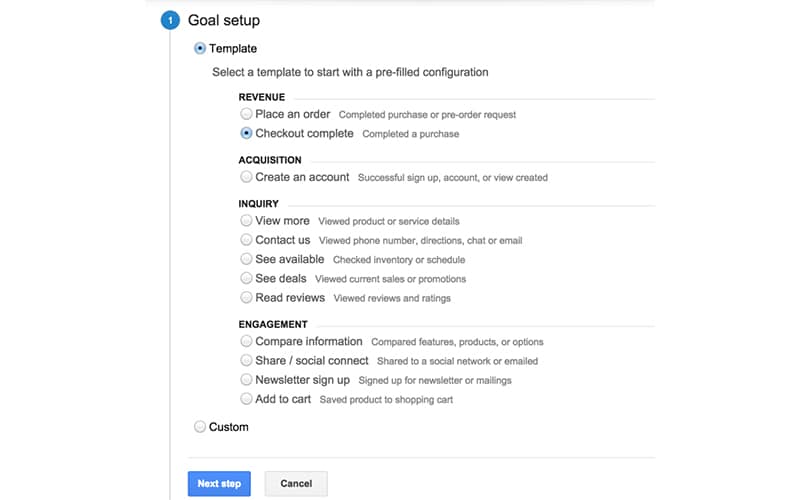
Step 3: Describe The Goal
Now, you need to describe your goal and define the type of event you want to track. Give it a descriptive name to help you identify the goal in your reports. Then, choose the destination option because you want to track if customers reach your success or thank you page.
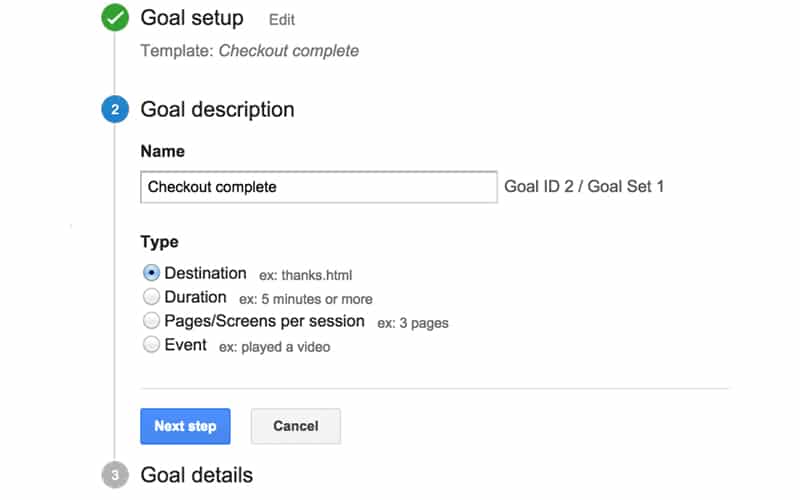
Step 4: Define The Success URL
For Google Analytics to track if a customer has made a purchase it needs to know what the success page is. This is typically the page a customer sees after making a purchase. When customers land on this page, it implies that they’ve made a purchase, otherwise they wouldn’t be seeing the page.
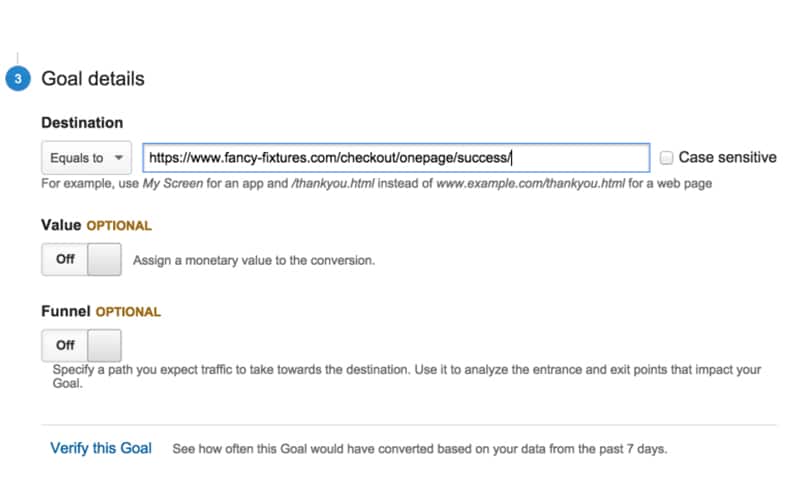
If you don’t know what your success URL is, you might have to make a dummy purchase and copy the URL into Google Analytics. Typically, they are static URLs like the one in the image, so you can select the ‘Equals to’ option.
If your success URL isn’t static, and some eCommerce platforms generate dynamic URLs, you’ll have to choose the ‘Begins with’ option and enter the first part of the URL. For example, you might find that the URL is www.storename.com/checkout/success/4556958609. That number at the end will change for each new customer, so enter only the static part that comes before it.
Step 5: Create The Funnel
The funnel will help you identify the path that customers take to conversion. To create yours, you’ll need to toggle it to ‘On’.
What you want to do is enter every URL that the customer passes through before reaching the destination URL (which is the success page). Again, you might have to do a dummy purchase and capture every URL so that you don’t make a mistake.
In this case there are 2 pages prior to checkout, the cart page and checkout page. However, it differs with each store and I’ve seen as many as 7 steps in a checkout process.
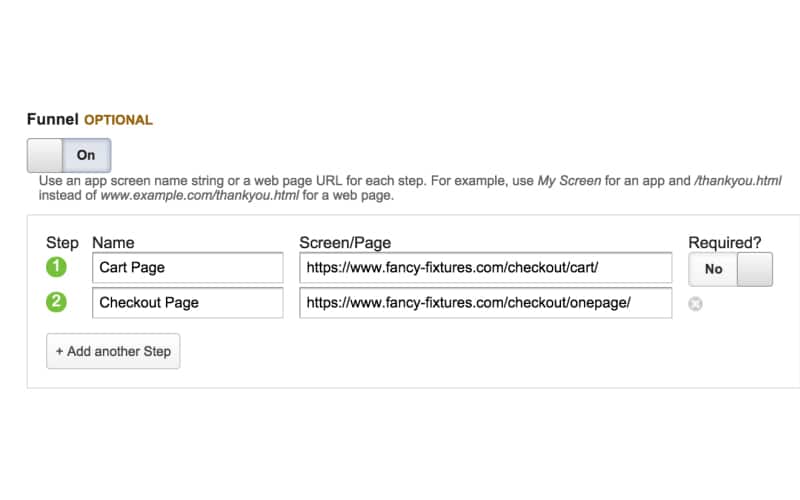
After you’re done creating the funnel, save the goal. Google Analytics will now start tracking it and you can see the results in your reports.
View Funnel Reports
Depending on your sales volume you might have to check your goal data and funnel statistics in a few days or weeks. This will give you enough time to figure out where customers are dropping out of your funnel.
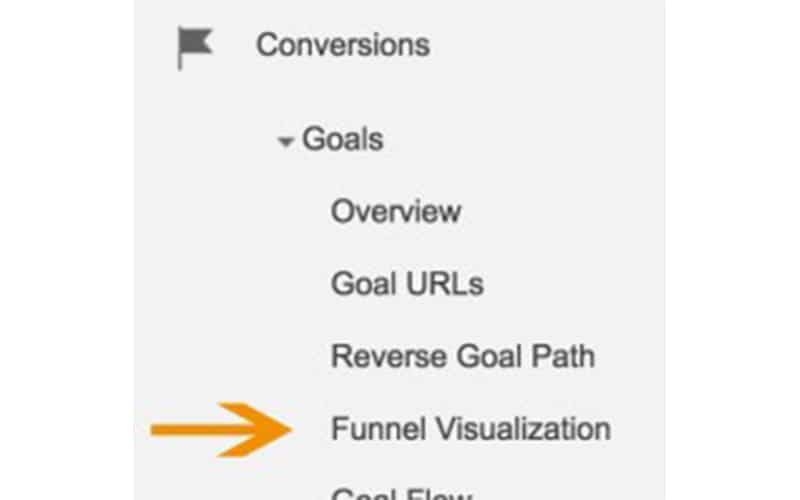
In the Reporting tab, go to the Conversions section and look at the funnel visualization for your Goal. Be sure to select which goal you’re looking at from the drop down.
Here Google Analytics will visually show you what’s going on in your funnel. Focus on trying to understand why consumers are abandoning their carts at certain steps in the checkout process.
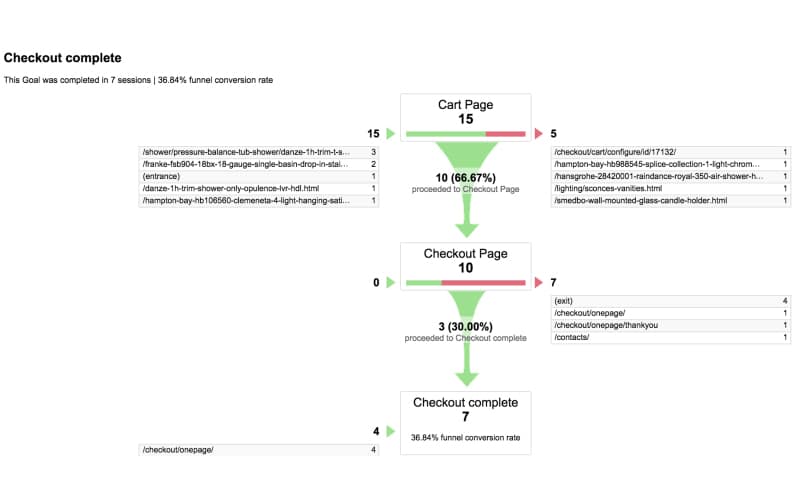
In this example, you can see that a third of customers who reach the cart page are dropping out. They are abandoning before they even see the checkout page. The exit column shows us that they’re going to other product pages, which implies they’re getting distracted. A good solution would be to create a less distracting version of the cart and test it against the current one.
Let’s have a look at a few more case studies and see how other stores have identified and fixed cart abandonment.
Practical Case Studies
LaTienda, an online food retailer from Spain, wanted to understand if shipping costs were contributing to their cart abandonment. Remember, we’ve already seen that 56% of shoppers abandon their cart because of unexpected costs like extra shipping fees.
To track this, they created a funnel in Google Analytics and segmented visitors based on geographical region. A simple way to do this is by going to the ‘Location’ reports under ‘Audience’ in Google Analytics. This will show you how people from various locations convert in your funnel.
What LaTienda noticed was that customers from region B abandoned their carts 48% more than customers from region A. Interestingly, region A was closer to their warehouse, while region B was further away. This meant that, because of their distance-based shipping policy, customers from region B had higher costs and tended to abandon more often.
To combat this, LaTienda decided to test a flat rate shipping model. They immediately saw a conversion increase of 70%.
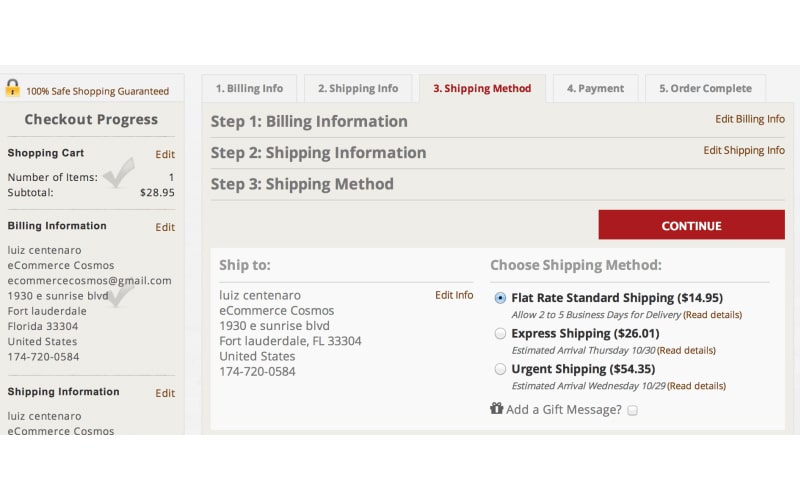
Another great example is a Swedish based online retailer of personalized gifts, NameOn.se. After setting up their cart abandonment funnel in Google Analytics they noticed a 31.7% drop off between the cart and checkout pages.
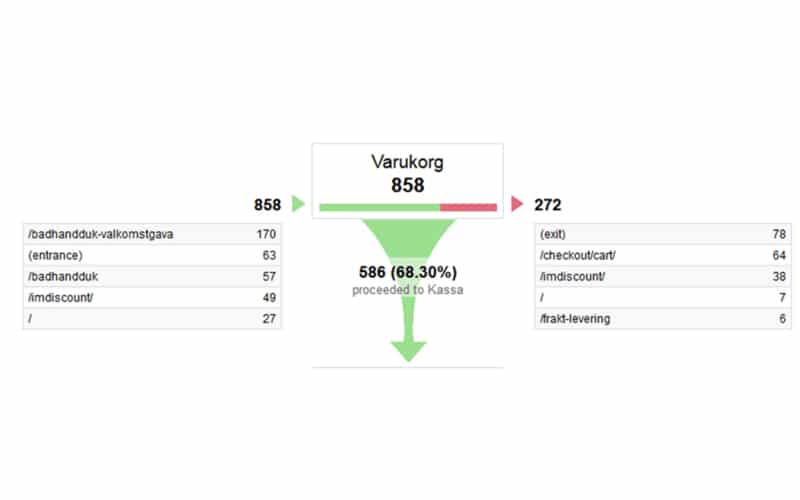
With a goal to increase conversions to the next step by 10% they had some work to do. On analyzing their original cart page, they found they had 9 Call To Actions! These included social media buttons, email subscription buttons, and a whole bunch of other things that had nothing to do with buying the product.
Imagine if you were at a physical store, and you were about to buy a product when a store employee came up to you and asked you to like them on Facebook, subscribe to their newsletter, and tweet about them. Unthinkable, right? Yet that’s exactly what many eCommerce stores do. This is a huge distraction for consumers moving into the final step of checkout.
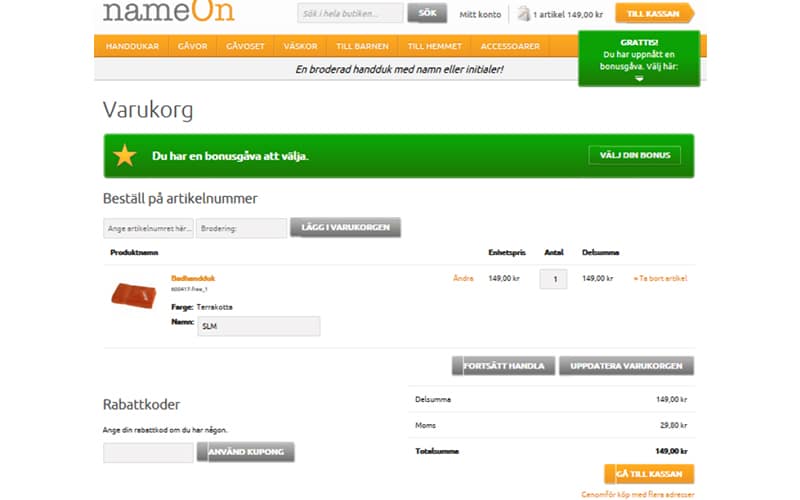
To solve the problem, NameOn create a variation that eliminated all unnecessary CTAs, and added a higher contrast Add To Cart Button.
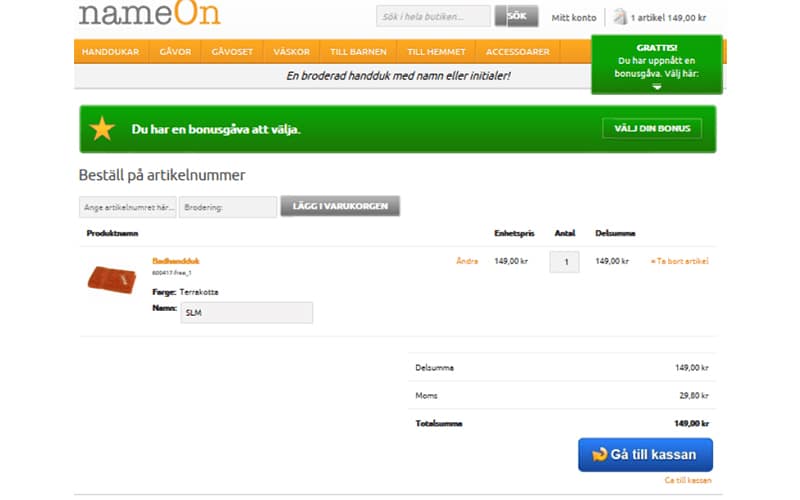
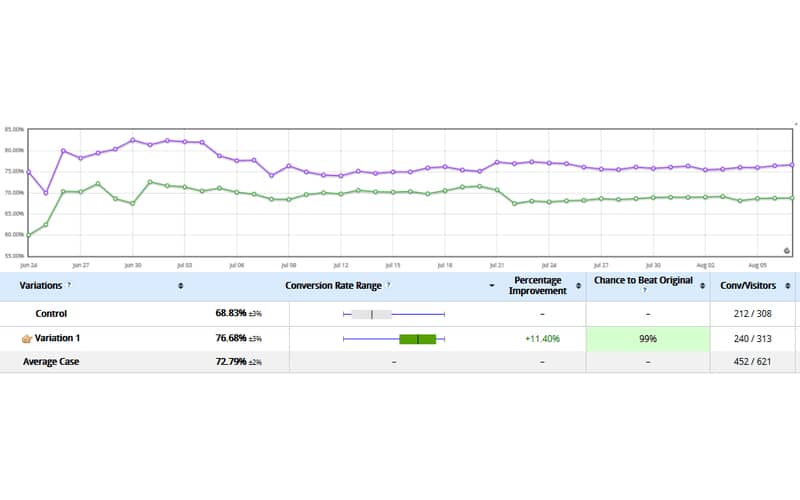
The results spoke for themselves with the clean variation showing a 11.40% increase in conversions over the original cart page. That seems like a small number, but it actually meant over $110,000 increase in yearly sales for NameOn.
The last example is from ConversionWorks.uk who used Google Analytics to identify where their clients’ site was leaking sales. Their targeted their checkout process specifically because they knew that they could see some big gains with small changes.
After setting up their funnel, they found the leak in the checkout step right before adding payment details. As you can see, the data collection form on the left seems cramped and not very user-friendly. There were a lot of usability issues with it, so they tested out a cleaner design on the right.
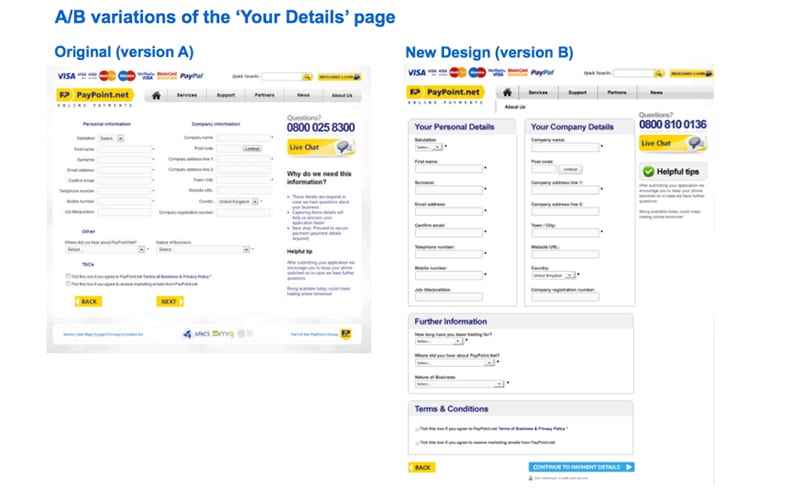
The changes aren’t really that big yet the results were huge. They were able to increase conversions to the next step by 159% with a 99.7% confidence.
Track And Testing Your Checkout Before The Holidays
So it’s almost Black Friday, then you have Cyber Monday, Thanksgiving, The Jewish Holidays, Christmas, and the New Year! This is when all the shopping happens. If you haven’t got your cart abandonment issues under control, you’ll be missing out on a lot of money.
Start by setting up the tracking funnel in Google Analytics. This should take less than 5 minutes. Use the checklist for reference.
Then, identify why people are abandoning your cart and think of some ways to stop it. You’ll need to test them to determine the best possible solution. To help you set up tests, we’ve created an A/B Testing eBook that walks you through the entire process.

